Quick Help and References |
|
| Description | |
|
RUBI is a new web server to detect regions of proteins which
are thought to contain ubiquitinated lysines.
RUBI uses an efficient and accurate prediction algorithm based on Bi-directional Recursive Neural
networks (BRNN's). BRNN's are a sequence based machine learning algorithm which have being found to be useful for other structural predictions .
The method is based solely on the sequence and does not use expensive computations to find multiple sequence alignments. RUBI also calculates some interesting statistics about all proteins submitted and on each protein individually. For the most detailed description of the methods and accuracy see our paper. | |
| Input (Single mode) | |
| E-Mail address | |
|
This is not a requirement. However, if you tick the "E-mail
notification of results" box then make sure your email address is
typed correctly. If no email is supplied do not close the window
(unless bookmarked) while waiting for the results.
| |
| Sequence Name | |
|
An optional title for your submission. This will appear in the header
of the output. We suggest you select one for your own records.
| |
| Sequence | |
All sequences submitted must be in fasta format.
Invalid amino acid types, spaces, return characters should be ignored by the server. However, we suggest that you keep the input in the
following format:
>P1
MIETPYYLIDKAKLTRNMERIAHVREKSGAKALLALKCFATWSVFDLMRD
YMDGTTSSSLFEVRLGRERFGKETHAYSVAYGDNEIDEVVSHADKIIFNS
ISQLERFADKAAGIARGLRLNPQVSSSSFDL
>P2
MTFSKELREASRPIIDDIYNDGFIQDLLAGKLSNQAVRQYLRADASYLK
EFTNIYAMLIPKMSSMEDVKFLVEQIEFMLEGEVEAHEVLADFINE
>P3
MENKKMNLLLFSGDYDKALASLIIANAAREMEIEVTIFCAFWGLLLLRD
PEKASQEDKSLYEQAFSSLTPREAEELPLSKMNLGGIGKKMLLEMMKEE
KAPKLSDLLSGARKK
>P4
MKKVFYPLACCCLAAGVFASCGGQKKANAQEEPSKVALSYSKSLKAPET
DSLNLPVDENGYITIFD
where P1, P2, P3 and P4 are the sequence identifiers. It is vital that all identifiers are unique. it is advisable to only use characters A-Z,a-z and 0-9 in the identifiers. For an example multiple fasta example see here and for an example single fasta see here. Once your sequence(s) are in fasta format there are two input types:
| |
| Options | |
|
RUBI produces a probability of lysine ubiquitination. A decision on what probability cut-off threshold produces 1% false positives and 5% false positives. Although, our method produces true Bayesian probabilities the data used to learn regions was imbalanced and therefore using 0.5 as the probability decision is not recommended. For this reason internal probability thresholds are defined on each predictors training set. The server hides this information from the user by allowing two types of threshold with respect to the training dataset:
ESpritz is a fast disorder predictor available here. Disorder is available in 3 styles. For a full description of the ESpritz styles and methods see ESpritz the paper. Rubi allows the user to select one of these 3 styles:
| |
| Output (Global stats) | |
| The first page the user sees is a global statistics and download page. | |
| Statistics on all proteins | |
The global statistics are in the following form: Total amino acids : ℕ Total lysines : ℕ Total ubiquitylated lysines : ℕ Total proteins : ℕ Total % Ubiquitylated : ℝ % of proteins with at least 1 Ubiquitylated lysine : ℝ % of proteins with at least 10 Ubiquitylated lysines : ℝ Mean number of ubiquitylated lysines (standard deviation) : ℝ (ℝ) | |
| Available files for download | |
Available for download is a Prediction archive (.tar.gz) archive containing:
| |
|
The Histogram of disordered segments graph. An example graph
is provided below. The x-axis contains the disorder segment ranked by its length.
The y-axis contains the length of the disorder segment. | |
Distribution amino acids: Also available to download is the distribution of amino acids in any state and in a disordered state.
An example graph is provided below. The x-axis contains the amino acid under investigation.
The red bars show the percentage that amino acid occurs. The blue bar shows the percentage of the red bar is disordered.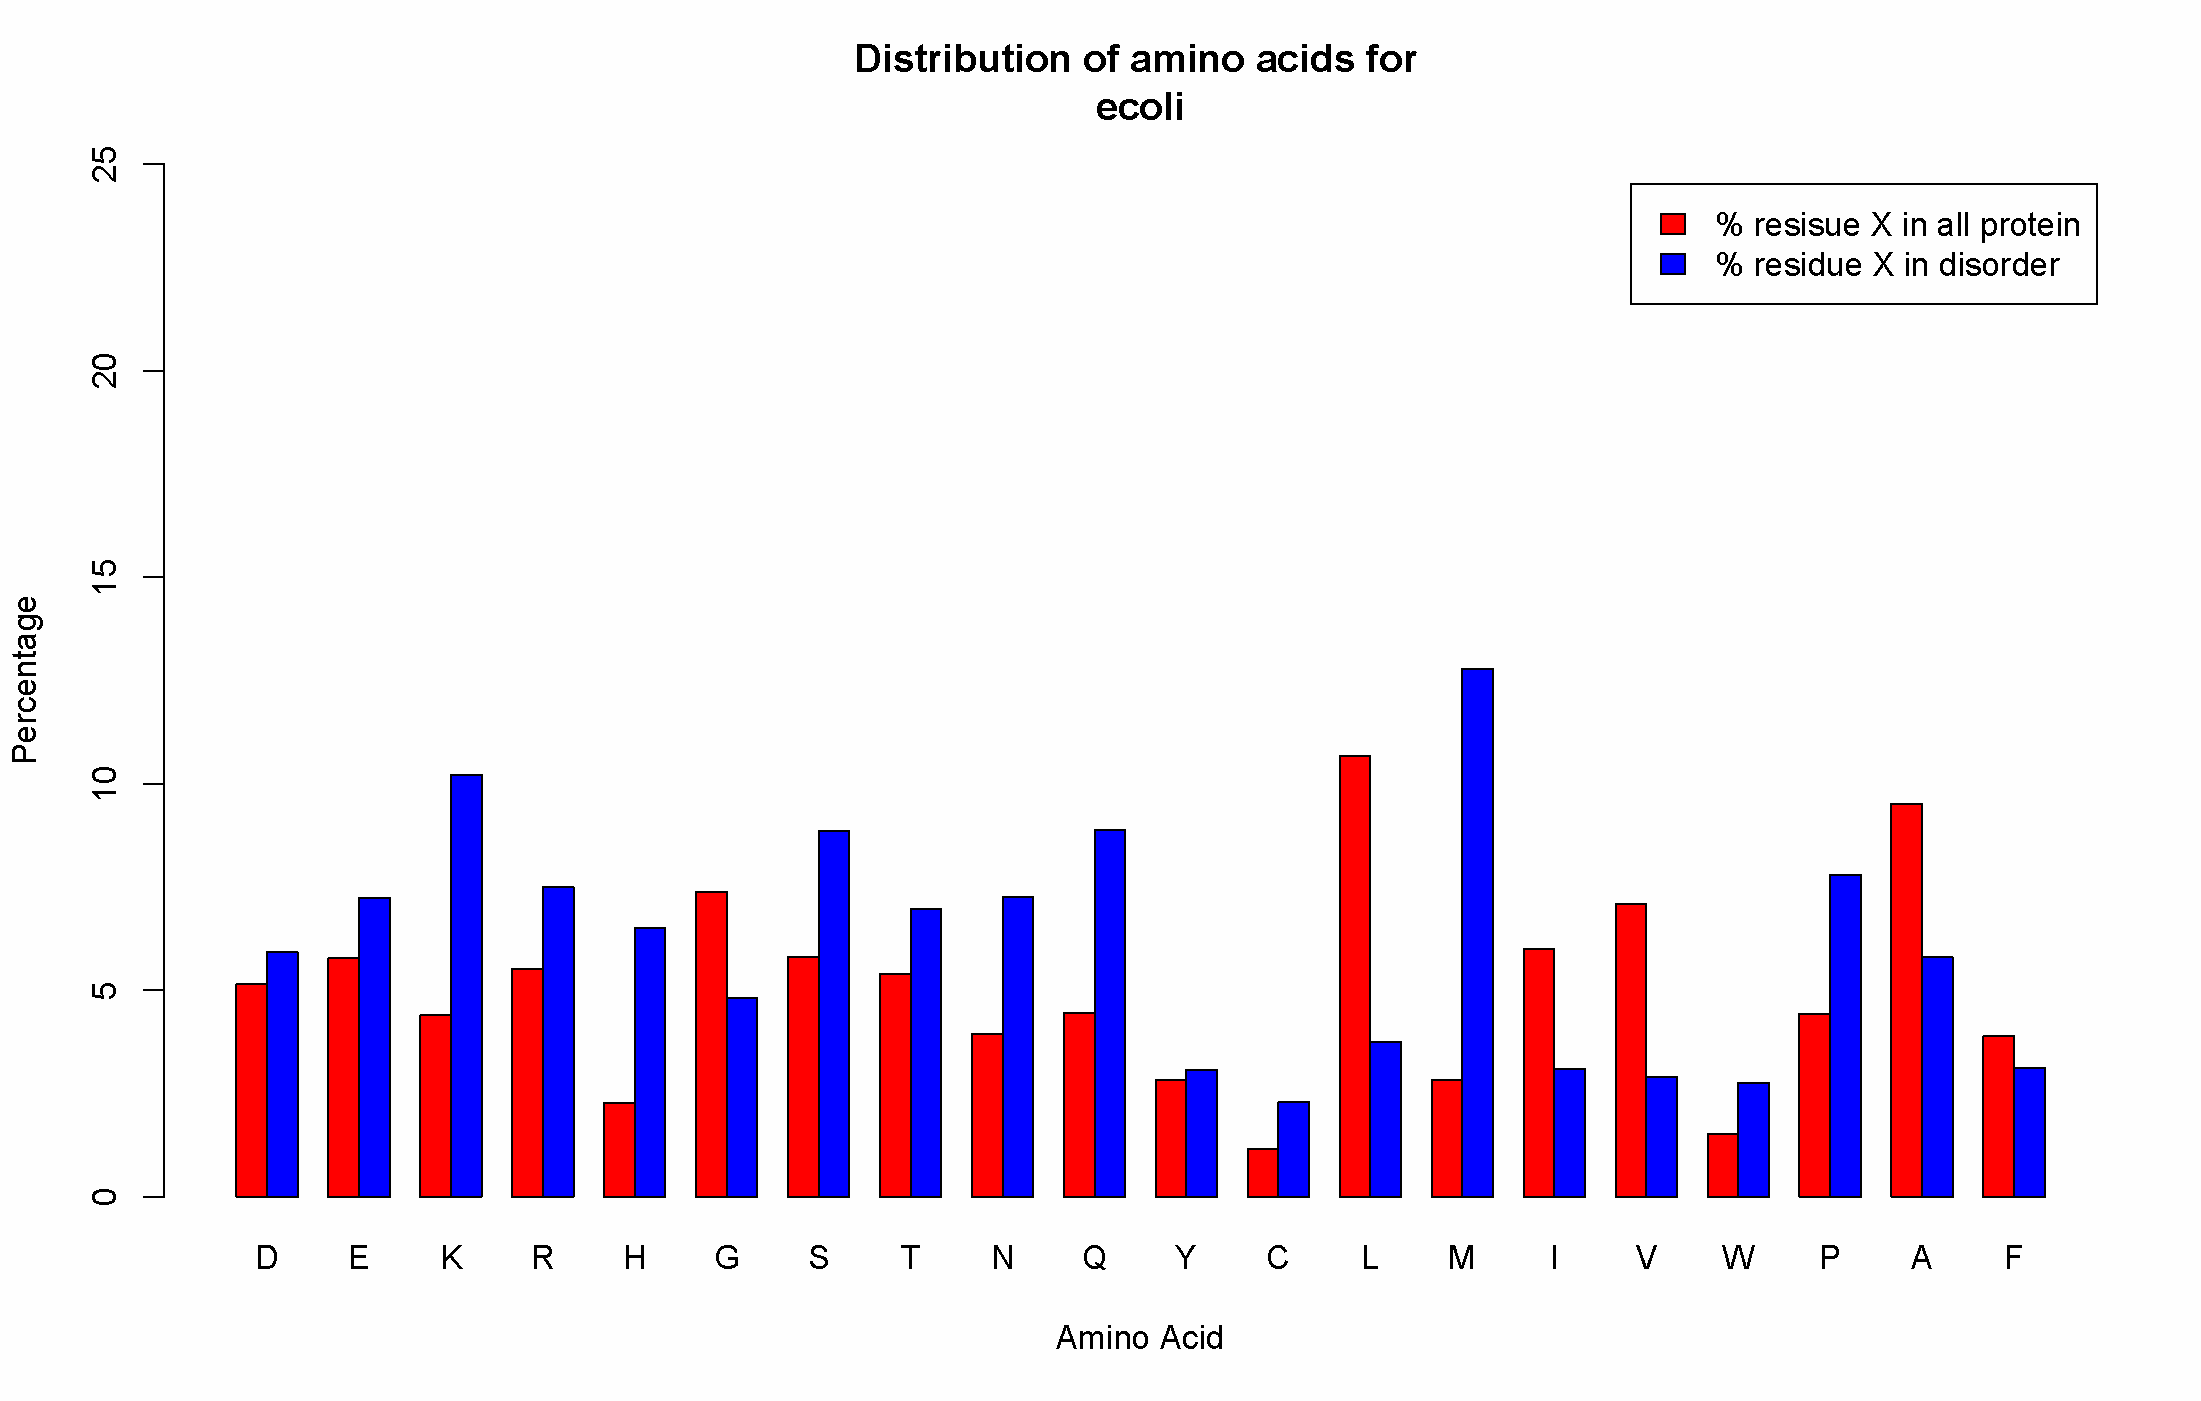
| |
Frequency of disorder in all and ubiquitinated lysines: The red bar shows the average probability of all lysines in disordered state.
The blue bar shows the average probability of ubiquitinated lysines in disordered state. The p-values were calculated using Wilcox rank sum test.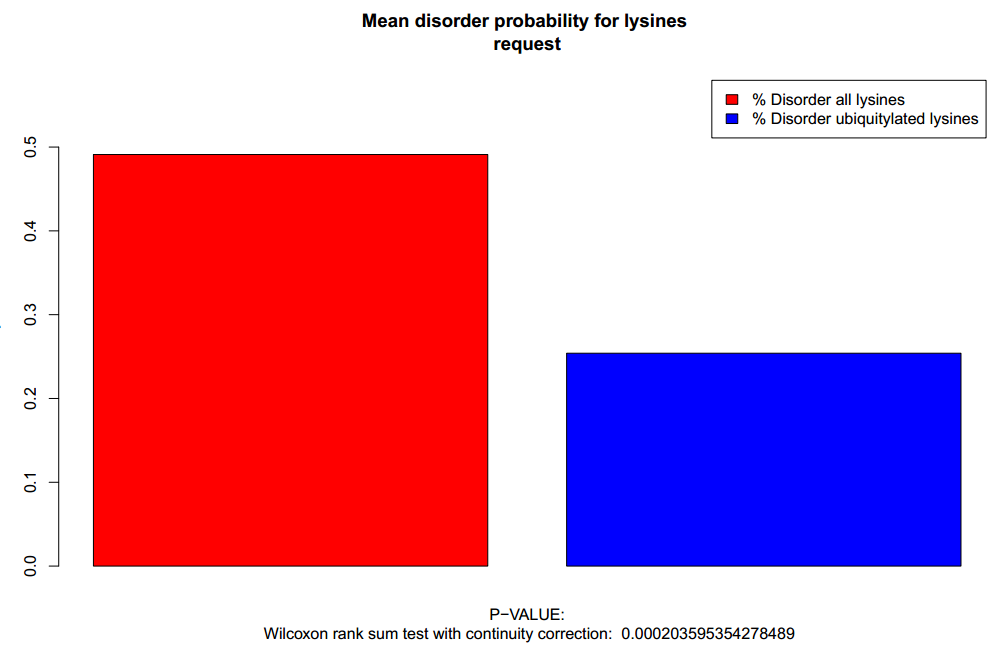 Frequency of structure in all and ubiquitinated lysines: The red bar shows the average probability of all lysines in structured state.
The blue bar shows the average probability of ubiquitinated lysines in structured state. The p-values were calculated using Wilcox rank sum test.
Frequency of structure in all and ubiquitinated lysines: The red bar shows the average probability of all lysines in structured state.
The blue bar shows the average probability of ubiquitinated lysines in structured state. The p-values were calculated using Wilcox rank sum test.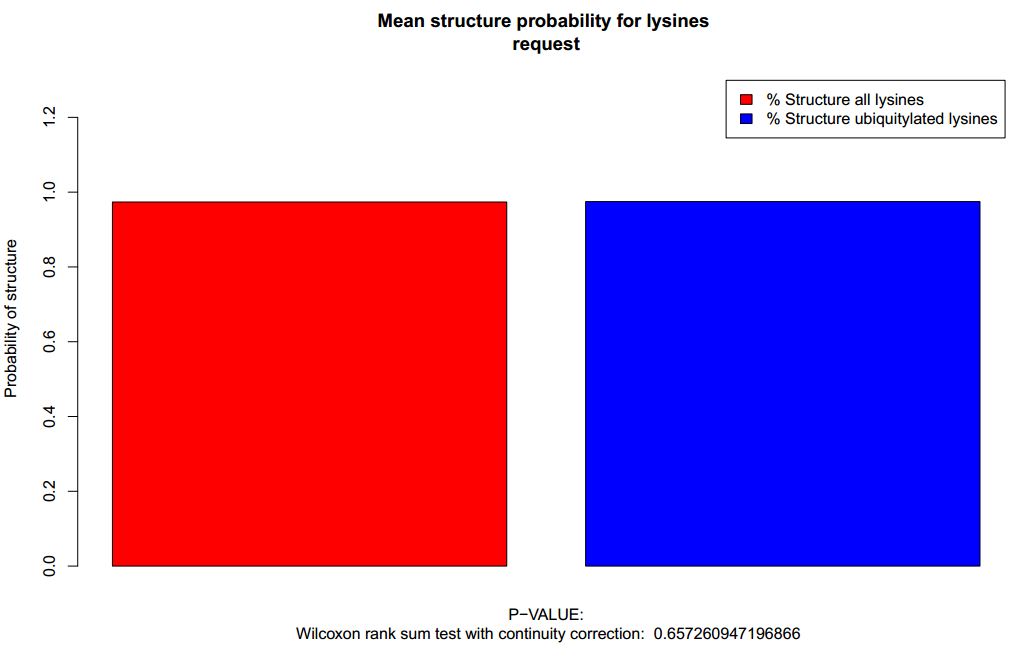
| |
| Links to individual protein pages | |
Finally, links to the individual proteins are available (see next section). An example list is shown below. 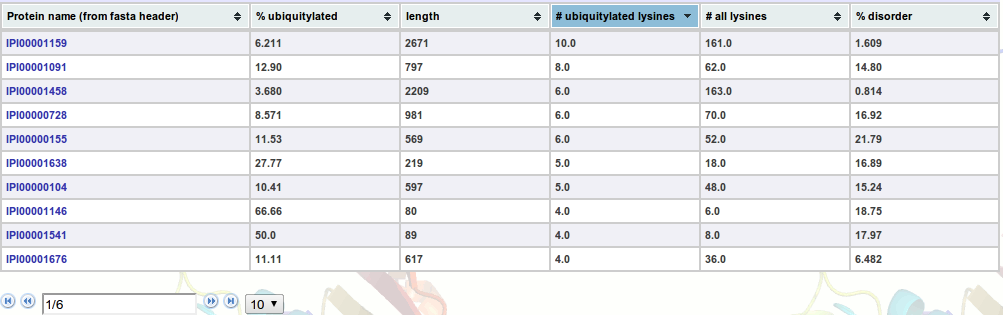 http://old.protein.bio.unipd.it/espritz/ We feel it is important to rank this list considering it may be a very large list. We allow rankings by %disorder, number of lysines, number of ubiquitinated lysines, length and%ubiquitination. Each page of the list contains 10 proteins where the next 10 can be accessed by clicking the next arrow button. | |
| Output (individual protein) | |
|
The output page presented for each protein gives a quick overview of the proteins disorder and statistics. In addition,
secondary structure and linear motifs are presented for each disorder segment.
|
|
| Available files and links | |
|
|
|
| Ubiquitinated and disordered residue and stats: | |
This panel consists of two pieces of information:
|
|
| Examples | |
|
Here we present 1 single fasta pasted example, all the sequences from Wagner et al. This section should also serve as a tutorial of how to use RUBI. Example 1 - Human p53. UniProt ID: P04637, 393 residues calculations with short option. Input: input page for human p53.
Multiple protein example 2 - Human proteins from Wagner et al [3].
4273 proteins. Download the human fasta sequences, hit browse on the input page and upload the file. This
example will be useful for future reference when processing multiple files.
| |
| References | |
| |